Manage Orders with Jumpseller
We know that sometimes our merchants have to deal with unexpected changes in their orders so we have created a guide to help you understand the ord...
In the dynamic world of e-commerce, understanding your store’s performance is crucial for sustained growth. The Jumpseller dashboard serves as your central hub for actionable insights, empowering you to make informed decisions and drive sales. Let’s explore each section and learn how to leverage these metrics to optimize your online business.
In this article, we take you through each section of the Jumpseller dashboard.
If you would like to get more detailed metrics, go to the reports section
Navigate to your store’s dashboard by logging into your admin panel and selecting Analytics > Overview from the left sidebar.
Begin by setting the date range in the top right corner to analyze specific periods. You can view data from a single day up to a year, enabling you to track trends and seasonal variations.
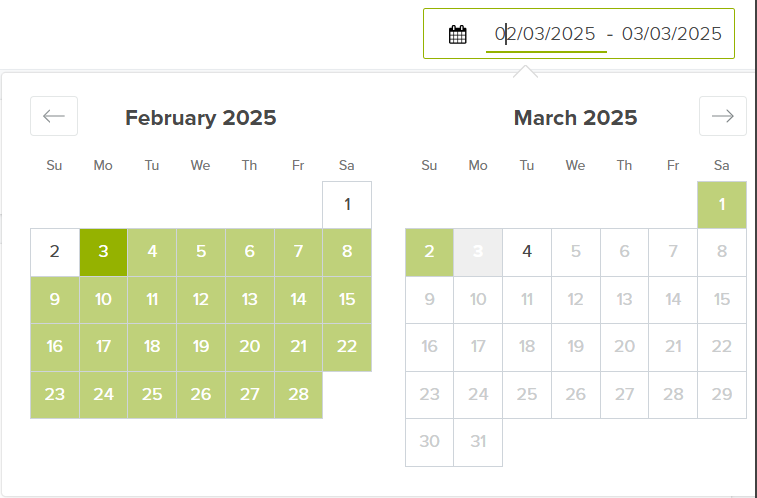
Note: The maximum limit for viewing previous data is one year from the current date.
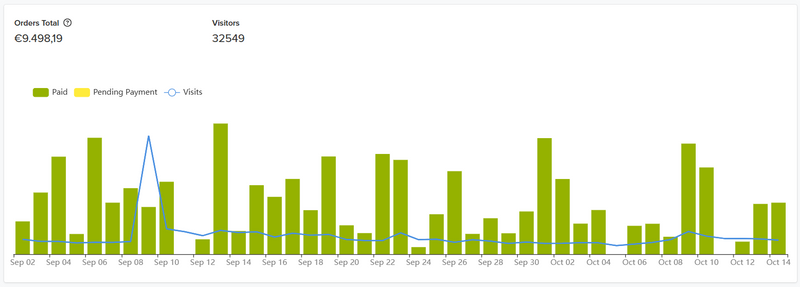
Get an overview of your recent sales performance with the boxes displaying the total order value (from paid and pending payments) made Today, Yesterday, and Last 7 Days, as well as the total visitors over the selected time period. This provides a quick pulse check on your store’s activity.
With this graph, you can identify sales trends and notice the day where you were able to turn more visitors into buyers and, check the order’s history, what was the reason behind that result (e.g. a product promotion) which you could replicate again.
The data of your Dashboard, are direct from our server, that is, real numbers of your page views. The numbers from Google Analytics and other analytics platforms are estimates, since many browsers or people simply block Google Analytics Javascript (or similar).
We also do our best to filter out bots in our statistics, so they should not be part of the visitors stats. The difference between our visitor numbers and Google Analytics might be because we count each visit separately, while Google Analytics may group them by user. So, if someone visits the store 4 times in a day, we count it as 4 visits.
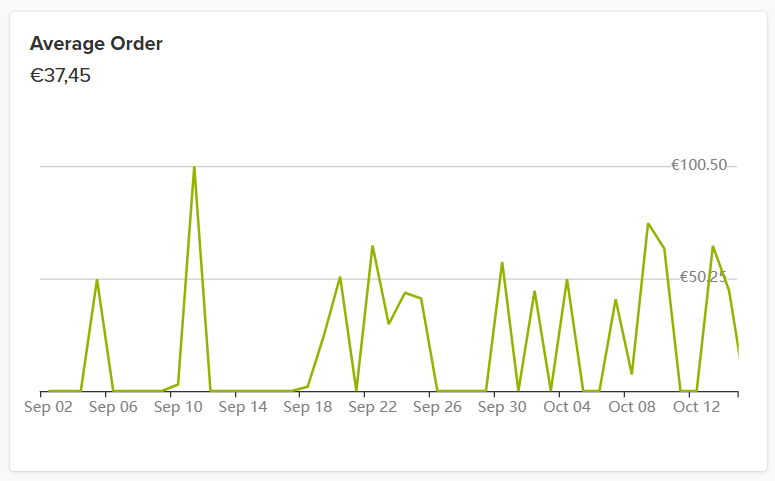
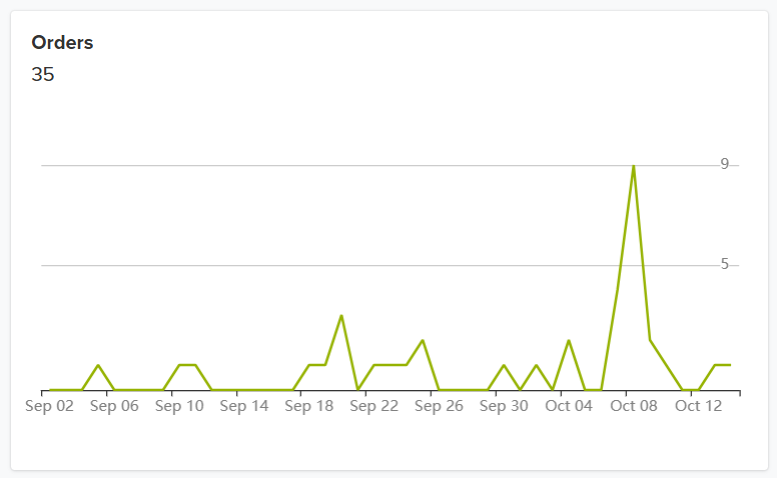
In the second section, you can find some more important metrics to evaluate your store’s performance. These include:
Average Order Size: The average order’s total amount per day (based on the time period selected in the previous section (e.g. week or month) and the number is the average of those data points).
Total Orders: Total orders for the time period.
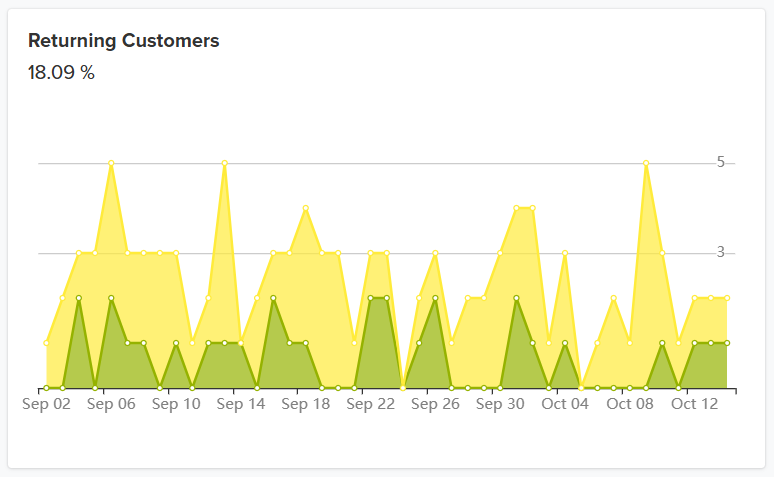
Returning Customers: See the percentage of customers that came back to your store.
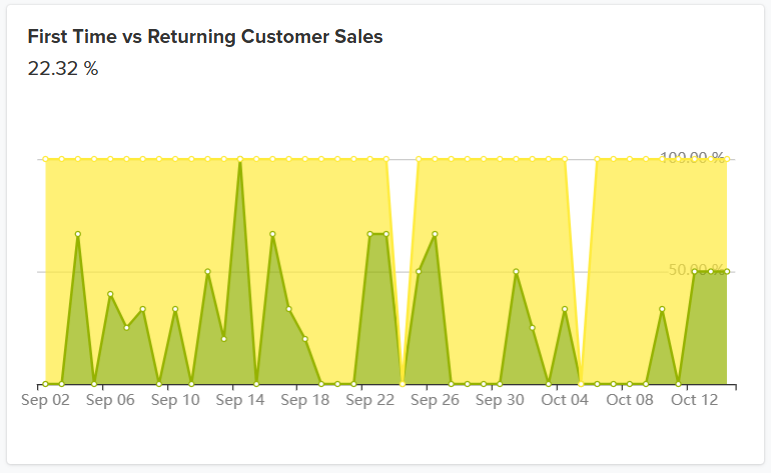
First Time vs Returning Customer Sales: See the percentage of orders created by returning customers and new customers, on a scale of 1-100% for the selected time period.
You have the Conversion Funnel in this next section of the dashboard, this breaks down your customers buying journey and tells you how many customers you are actually converting to sales. You will find here the percentage of customers who:
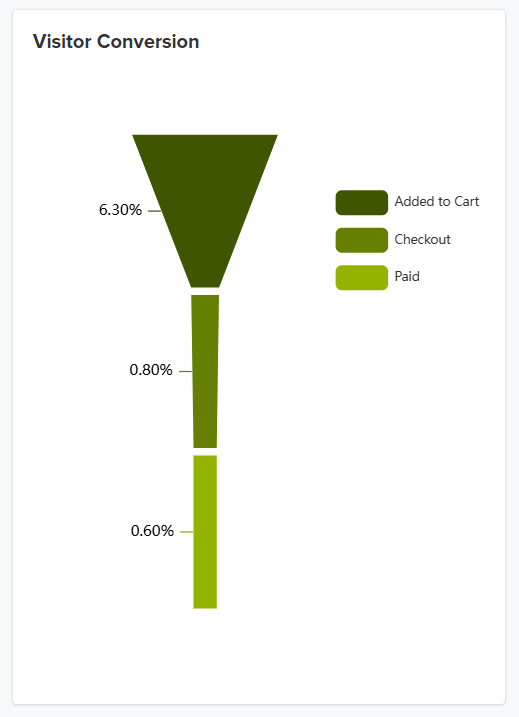
In Jumpseller, the reported conversion rate includes Mercado Libre sales, and other sales channels. Still, keep in mind that these sales do not go through to Google Analyticsm since there is no real conversion record in checkout. In other words, there is no way for Gogle to understand that there were purchases in other external applications.
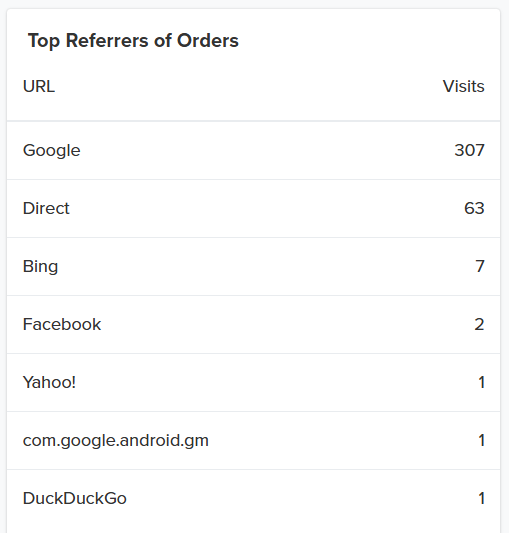
You also have a list of your Top Referrers here, this is useful as it will help you identify which links are providing value to you and you can then boost those links to make them more prominent for your target audience.
In the next box, you have your top 10 Best Sold Products, if you know what your customers like you can increase sales by making those products more visible on your website or even creating special promotions to make them stand out.
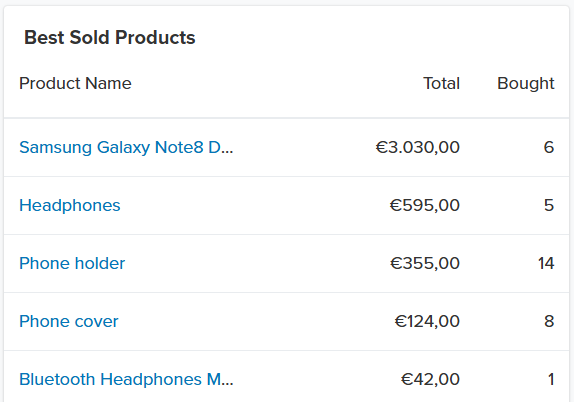
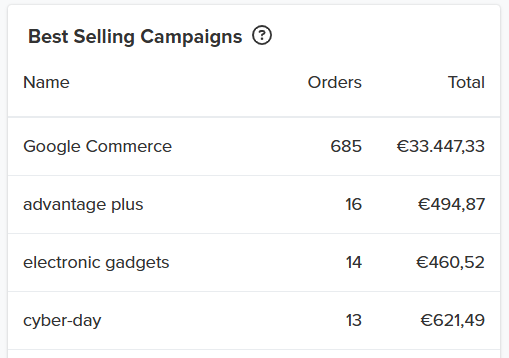
Display the top campaigns where orders are being generated based on the campaign name and source (taking into account the utm_campaign and utm_source).
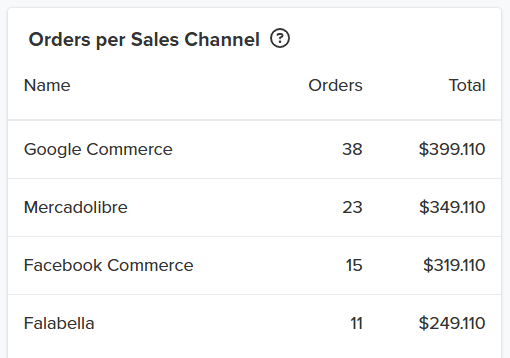
Only paid orders attributed to sales channels (Google Commerce, Facebook Commerce, Mercado Libre, etc.) through their utm_source are included. This information might not match entirely with other dashboards, such as Google Ads, Google Analytics, or Facebook Metrics.
This happens mainly because Analytics has limited access to the information and there are things that are considered as sales in your store that are not considered as sales in the Ads platform. Therefore, you will always find the most accurate information in the statistics panel of the store.
In the next section, you will find information about the Traffic coming to your store, this can help you decide what marketing channels to prioritize or to improve.
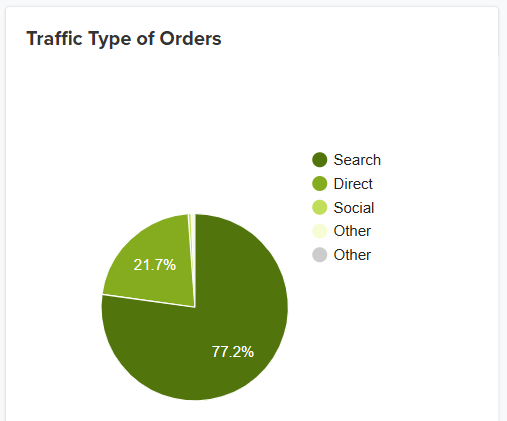
Search: Traffic from search engine results (not paid).
Paid: Traffic coming from Paid Ads like Google Ads.
Direct: All those people showing up to your Web site by typing in the URL of your Web site or from a bookmark.
Referral: Other Websites sending traffic to you. These could be as a result of your banner ads or campaigns or blogs or affiliates who link to you.
Social: Traffic from social channels like Facebook.
Others: Includes any campaigns you have run, e-mail, direct marketing, etc.
Here you can see the countries from which your visitors are from. Hover over each country to see the numbers by city.
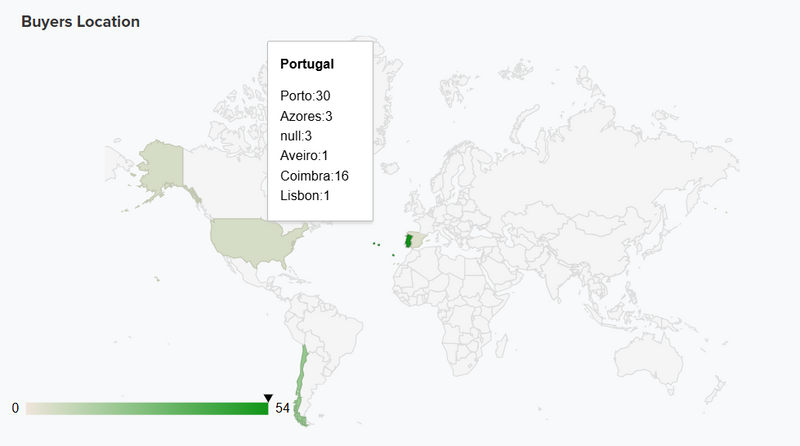
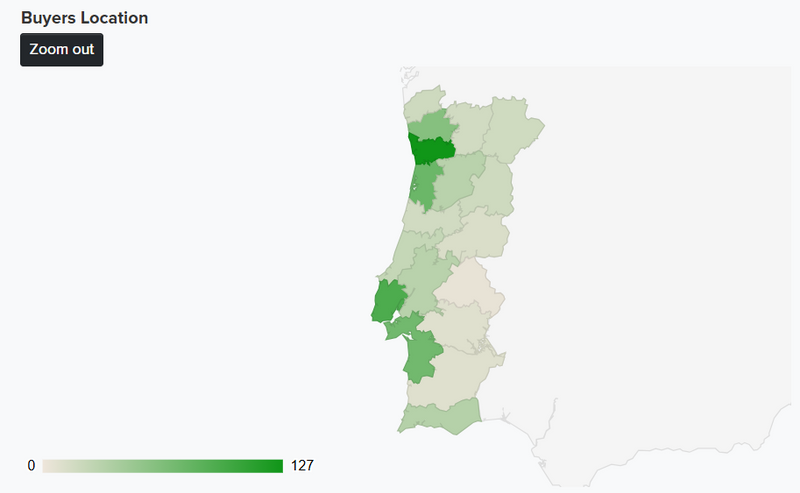
Another way to see in more detail the number of visitors inside a country is to click on it. Click on “Zoom out” to reset it back to the world view.
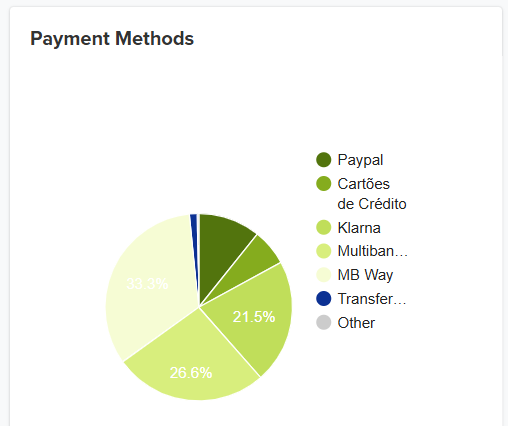
Displays the most used payment methods to pay for the orders.
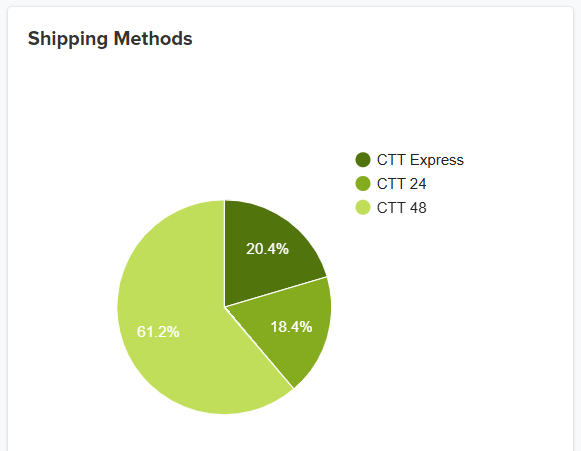
Displays the most used shipping methods chosen by customers on checkout.
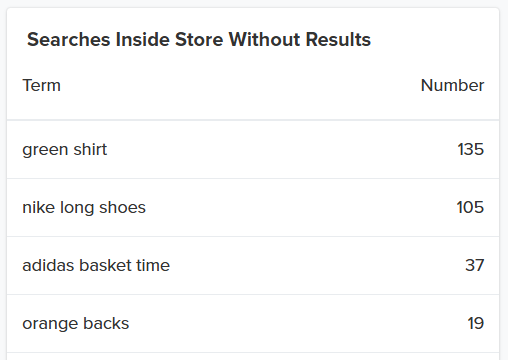
Displays the top search terms done by visitors inside the store. It is insightfull to know what the customers search in your store and what they expect to find.
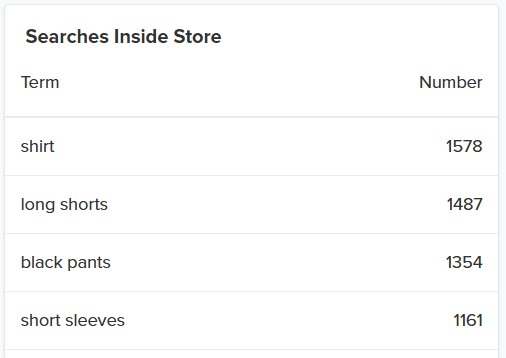
This insights can be great to understand some products your visitors are interested in and you could take advantage by trying to add to your store
As you can see you can get a lot of insights from your customer’s behavior using your store’s dashboard statistics. Using these statistics you can identify possible ways to improve your sales.
Note: we only mantain the top 10 results for each month from these two lists.
If you have any further questions, please don’t hesitate to contact us.
Why am I getting a different number of visitors on Jumpseller’s dashboard and on Google Analytics?
Visits, visitors, sessions and users are different metrics in Google Analytics. In your Jumpseller store dashboard we show visits. A person (user) can visit your store several times, in the case of the admin in Jumpseller if the same user visits your store twice at different times, it counts as two sessions.
On the other hand, in Analytics it shows you 1 user because it is the same person/user, even if he/she has visited the store twice at different times.
The time zone settings in the store, in your Google Analytics and other settings in the Google Analytics account can make the metrics slightly different.
To better understand the difference between Google Ads clicks and sessions, users, posts, page views and unique page views in Analytics, please read this article
Is there a way to get more detailed metrics?
You can access Analytics > Reports to get more granular data regarding user acquisition, products sold, and sales by type of customer.
Start your free 7-day trial. No credit card required.